
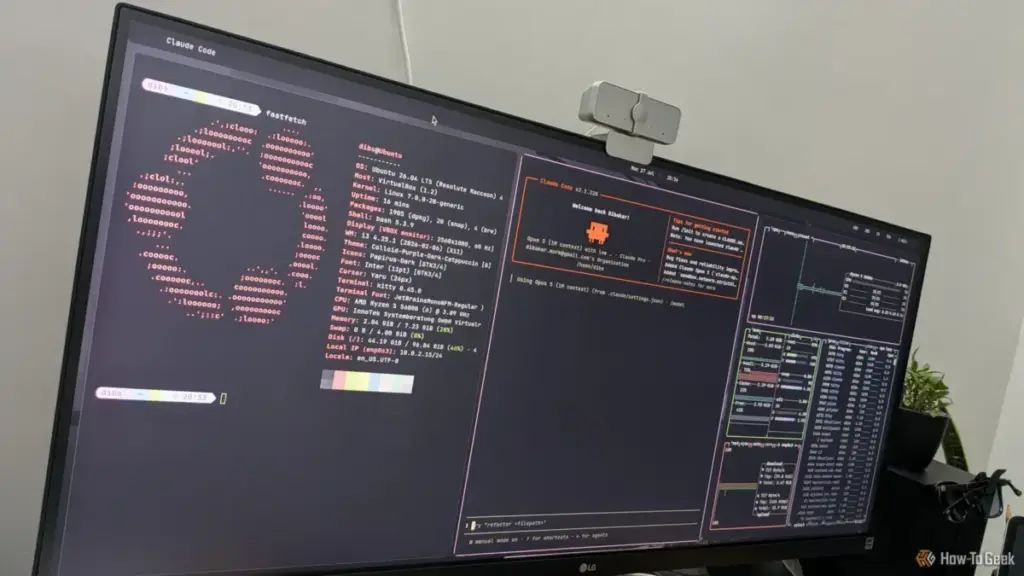
The terminal has long been the sanctuary of the Linux power user—a place where efficiency overrides aesthetics and where text-based commands provide unparalleled control over the machine. For decades, system monitoring in this environment was dominated by a handful of venerable tools. The "top" command, a staple since the early days of Unix, provided a functional but Spartan list of processes. Later, "htop" introduced color and a more navigable interface, becoming the de facto standard for administrators and enthusiasts alike. However, as hardware has grown more complex and user expectations for interface design have evolved, a new contender has emerged to bridge the gap between terminal efficiency and desktop-class visualization.
That contender is btop. Formally known as btop++, this open-source resource monitor is transforming the way users interact with their system data. By offering a comprehensive, interactive, and visually striking dashboard entirely within the terminal, btop is making a compelling case for why the classic tools of the past may finally be ready for retirement.
The Evolution of Terminal Monitoring
The journey to btop is a fascinating case study in software evolution. Developed by the programmer known as aristocratos, the project did not begin in its current, highly optimized state. Instead, it represents the third iteration of a vision to create the ultimate terminal-based monitor. The lineage began with "bashtop," a resource monitor written entirely as a shell script. While impressive in its ingenuity, the limitations of Bash meant that as the tool grew in complexity, it faced performance bottlenecks.
To address these issues, the developer transitioned to "bpytop," a version written in Python. This iteration allowed for more advanced features and better handling of system data, but Python’s interpreted nature still introduced a level of computational overhead that some users found counterintuitive for a tool meant to monitor resources, not consume them.
The breakthrough came in May 2021 with the announcement of the C++ rewrite. By moving to a compiled language, btop—now often referred to as btop++ to signify its C++ roots—achieved a level of speed and efficiency that its predecessors could not match. Released for Linux in September 2021, the 1.0.0 version featured a system data collection engine written entirely from scratch, devoid of external libraries. This lean architecture ensures that btop remains responsive even when the system is under heavy load, providing accurate, real-time data when the user needs it most.
The Visual Revolution: More Than Just a List of Processes
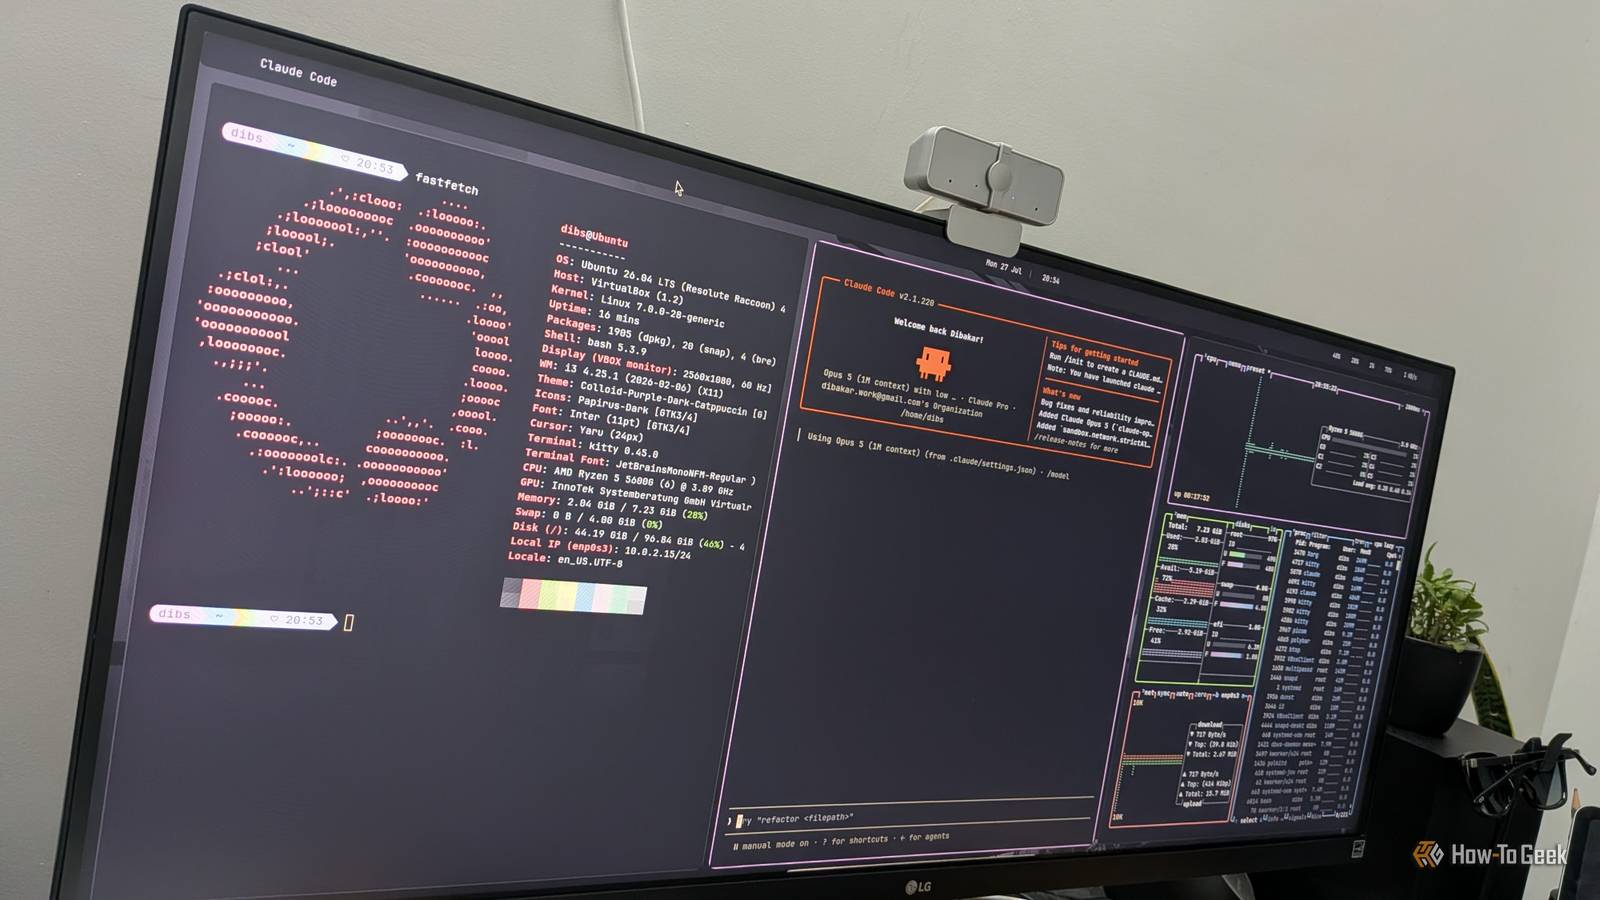
The first thing any user notices upon launching btop is its striking visual presentation. While traditional tools like "top" present a wall of text, btop greets the user with a vibrant, multi-paneled dashboard. It utilizes Unicode symbols and Braille patterns to render smooth, high-resolution graphs for CPU load, memory usage, and network traffic.
This "dashboard" approach is not merely for show; it is designed for immediate information density. On a single screen, a user can see the per-core utilization of their processor, the breakdown of used versus cached memory, disk read and write speeds, and even the temperature of various hardware components. For laptop users, a dedicated battery meter provides essential information about power status without requiring the user to glance at a desktop tray icon.
The network section is particularly noteworthy. Unlike many terminal tools that provide static numbers, btop features a dynamic network graph that scales automatically. Whether a connection is idling at a few kilobytes or saturating a gigabit line, the graph remains readable and informative. This level of visual polish makes btop feel less like a legacy command-line utility and more like a modern professional monitoring suite.
Granular Control and Interaction
Beyond its visual appeal, btop differentiates itself through its deep interactivity. One of the most significant departures from traditional terminal monitors is its full support for mouse input. In an environment where the keyboard is usually king, btop allows users to click buttons, scroll through process lists, and navigate menus with a mouse or touchpad. This hybrid approach makes the tool accessible to those transitioning from graphical operating systems while remaining fully functional for keyboard purists.
The process management interface is where btop truly shines as a productivity tool. Users can navigate the process list using arrow keys or the mouse, but the functionality goes far beyond simple scrolling. The tool includes a robust filtering system, allowing users to find specific programs instantly. It also supports a "tree view," which visually maps the parent-child relationships between processes—an invaluable feature for identifying which specific tab or sub-process is causing a browser or development environment to hang.
When a process does misbehave, btop provides a streamlined workflow for intervention. Rather than requiring the user to memorize process IDs (PIDs) and manually type "kill" commands in a separate terminal window, btop allows users to select a process and send signals—such as SIGTERM, SIGINT, or SIGKILL—directly from the interface. This consolidation of monitoring and management into a single interactive pane significantly reduces the time required to troubleshoot system slowdowns.

A Performance-First Philosophy: The Shift to C++
The decision to build btop in C++ was driven by the need for systemic transparency with minimal impact. A resource monitor that consumes significant CPU cycles is, in many ways, a paradox. By utilizing C++, btop achieves a "near-metal" performance profile. The data collection is handled by a custom-built engine that interacts directly with the operating system’s kernels, whether it be the Linux procfs, the macOS IOKit, or the FreeBSD sysctl interface.
This efficiency is especially critical for users with older hardware or those managing high-density servers where every megabyte of RAM and every clock cycle counts. Despite its rich graphics and frequent refresh rates, btop maintains a remarkably small footprint. This makes it an ideal choice for "always-on" monitoring in a dedicated terminal multiplexer like tmux or screen, where it can run in the background for days or weeks without degrading system performance.
Cross-Platform Versatility and Modern Hardware Support
While btop began as a Linux-centric project, its popularity has led to a significant expansion in platform support. Official versions now exist for macOS and FreeBSD, and a community-led port known as "btop4win" brings the experience to Windows users via a separate repository. This cross-platform availability is a boon for system administrators who work in heterogeneous environments, allowing them to use a consistent set of tools regardless of the operating system they are currently managing.
Furthermore, btop has kept pace with modern hardware trends, most notably in the realm of GPU monitoring. As Linux gaming and AI development have surged, the need to monitor graphics hardware has become paramount. Recent builds of btop include support for NVIDIA, AMD, and Intel GPUs. Depending on the hardware and the specific binary used, users can track GPU utilization, VRAM consumption, power draw, and clock speeds right alongside their CPU metrics. While the depth of reporting varies—Intel hardware currently provides a more limited set of metrics compared to NVIDIA—the inclusion of GPU data completes the picture of total system health.
Customization and User Experience
For the modern Linux user, customization is often as important as functionality. btop addresses this through a deep but accessible configuration system. Rather than forcing users to manually edit cryptic text files (though that option remains available), btop includes a built-in, game-inspired menu system. Users can change themes, adjust graph symbols, toggle specific boxes on or off, and modify the update frequency—all from within the application.
The theme support is particularly robust. btop can search through system-wide theme directories or a user-specific folder in the .config directory. This has fostered a community of users who share custom color schemes, ranging from high-contrast "matrix" greens to soft "Nord" pastels, ensuring the monitor matches the aesthetic of the user’s overall desktop environment.
Practical Implementation and the Competitive Landscape
Despite its many advantages, btop exists in a competitive ecosystem. For many, the classic "top" or "htop" is "good enough." On a minimal, headless server where the goal is a five-second check of the load average, the overhead of installing a new tool might not be justified. Furthermore, btop’s reliance on color and Unicode symbols means it is best experienced in a modern terminal emulator that supports "truecolor" (24-bit color). While btop does offer a low-color mode for older TTYs and serial consoles, the experience loses much of the visual flair that makes it unique.
There is also the question of automated parsing. btop is designed for human eyes; its output is complex and interactive. For scripts and automated monitoring systems, simpler tools like "vmstat," "iostat," or "sar" remain the superior choice, as they provide raw data that is easily piped into other applications.
However, for the desktop user, the developer, or the enthusiast, the "cost" of entry is negligible. btop is packaged in the official repositories of almost every major Linux distribution, including Ubuntu, Fedora, Arch, and Manjaro. For those on more conservative systems, a Snap package provides an easy installation path, and the source code is readily available on GitHub for those who prefer to compile their own binaries with specific hardware support enabled.
A New Standard for the Terminal
The rise of btop signifies a broader trend in the Linux community: the refusal to choose between power and beauty. It proves that the terminal does not have to be a place of austerity. By combining the data-rich environment of a professional dashboard with the speed of C++ and the accessibility of a modern UI, btop has earned its place as a must-have utility.
Whether you are a seasoned sysadmin looking for a faster way to kill runaway processes, or a newcomer wanting to see what’s happening under the hood of your new Linux installation, btop offers a window into your computer’s soul that is as informative as it is beautiful. It is a testament to the power of open-source development—taking a simple concept, refining it through multiple iterations, and ultimately producing a tool that feels essential from the very first time you type its name into the prompt.
 Tech Tutorials & How-To Guides
Exploring the Frontiers of the Unknown: Three Essential Science Fiction Films to Stream on Netflix This Weekend
As the autumn of 2026 unfolds, the digital landscape of the American...
 Tech Tutorials & How-To Guides
Beyond the Drill: How Ryobi’s ONE+ Ecosystem is Redefining the Modern Home and Workshop
For decades, the image of a cordless power tool was tethered strictly...
 Tech Tutorials & How-To Guides
Bridging the Security Gap: Replicating the YubiKey Experience with a $6 ESP32 Microcontroller
In an era where digital identity is under constant siege from sophisticated...