The terminal has long been the sanctuary of the Linux power user—a place where efficiency overrides aesthetics and where text-based commands provide unparalleled control over the machine. For decades, system monitoring in this environment was dominated by a handful of venerable tools. The "top" command, a staple since the early days of Unix, provided a functional but Spartan list of processes. Later, "htop" introduced color and a more navigable interface, becoming the de facto standard for administrators and enthusiasts alike. However, as hardware has grown more complex and user expectations for interface design have evolved, a new contender has emerged to bridge the gap between terminal efficiency and desktop-class visualization.
That contender is btop. Formally known as btop++, this open-source resource monitor is transforming the way users interact with their system data. By offering a comprehensive, interactive, and visually striking dashboard entirely within the terminal, btop is making a compelling case for why the classic tools of the past may finally be ready for retirement.
The Evolution of Terminal Monitoring
The journey to btop is a fascinating case study in software evolution. Developed by the programmer known as aristocratos, the project did not begin in its current, highly optimized state. Instead, it represents the third iteration of a vision to create the ultimate terminal-based monitor. The lineage began with "bashtop," a resource monitor written entirely as a shell script. While impressive in its ingenuity, the limitations of Bash meant that as the tool grew in complexity, it faced performance bottlenecks.
To address these issues, the developer transitioned to "bpytop," a version written in Python. This iteration allowed for more advanced features and better handling of system data, but Python’s interpreted nature still introduced a level of computational overhead that some users found counterintuitive for a tool meant to monitor resources, not consume them.
The breakthrough came in May 2021 with the announcement of the C++ rewrite. By moving to a compiled language, btop—now often referred to as btop++ to signify its C++ roots—achieved a level of speed and efficiency that its predecessors could not match. Released for Linux in September 2021, the 1.0.0 version featured a system data collection engine written entirely from scratch, devoid of external libraries. This lean architecture ensures that btop remains responsive even when the system is under heavy load, providing accurate, real-time data when the user needs it most.
The Visual Revolution: More Than Just a List of Processes
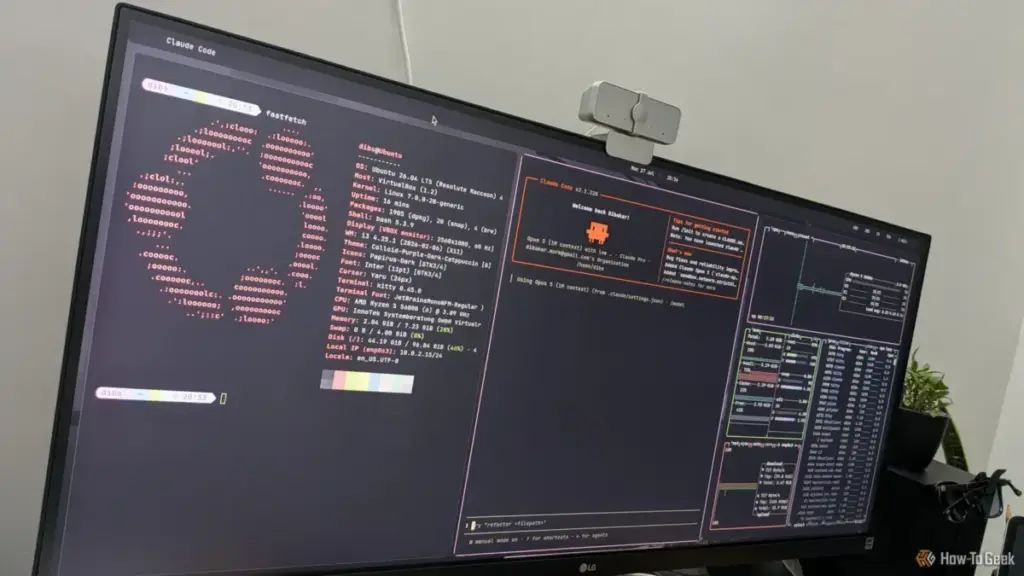
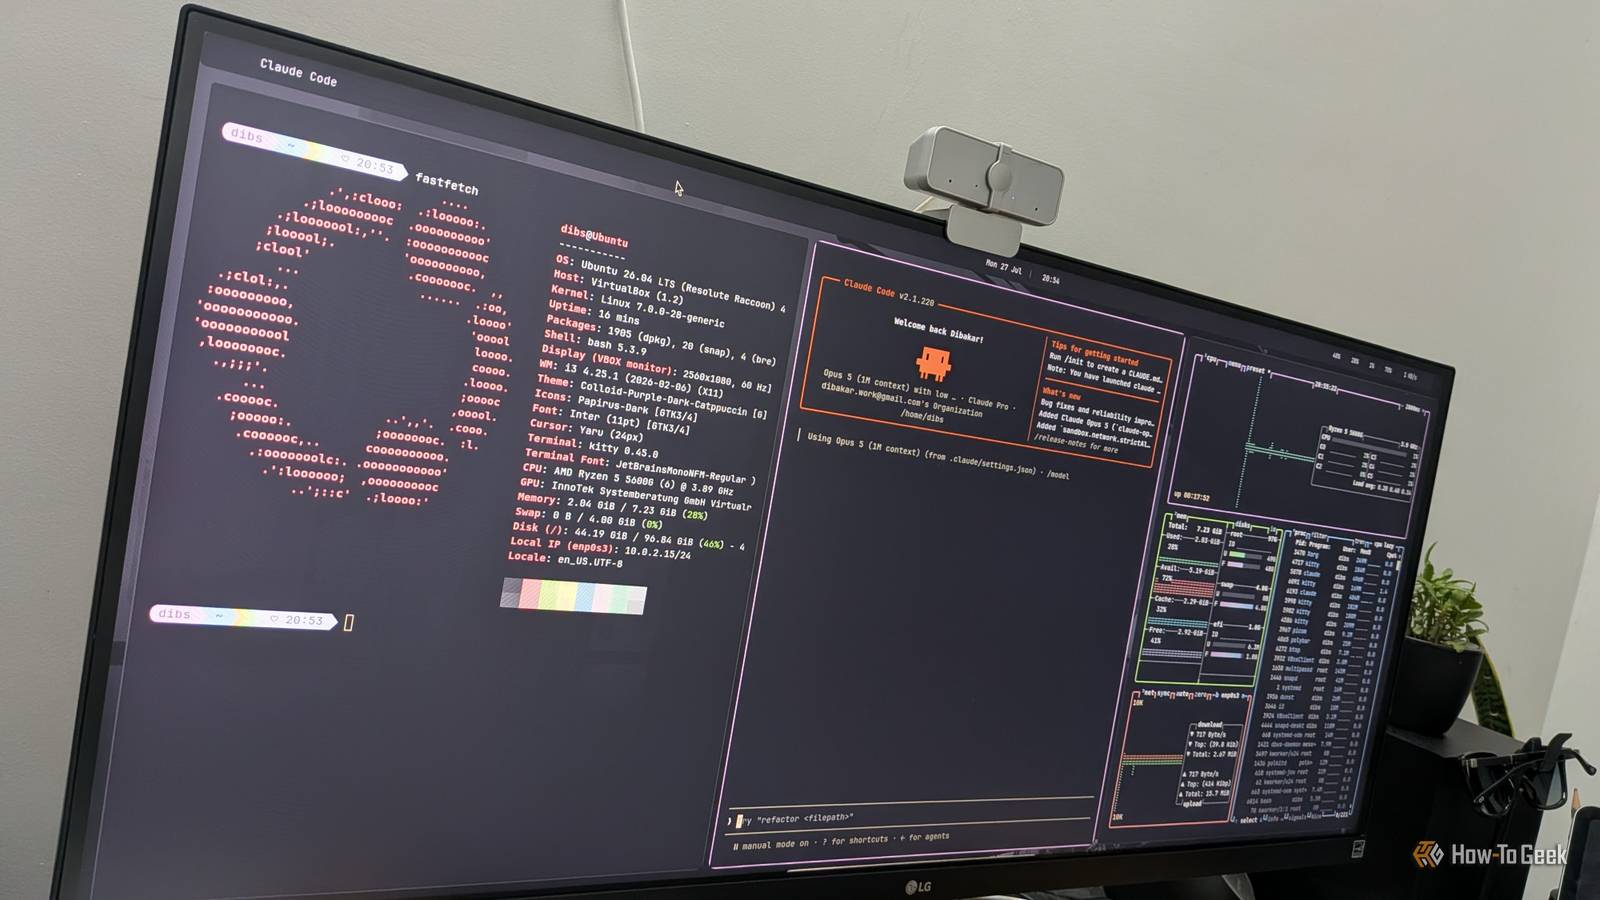
The first thing any user notices upon launching btop is its striking visual presentation. While traditional tools like "top" present a wall of text, btop greets the user with a vibrant, multi-paneled dashboard. It utilizes Unicode symbols and Braille patterns to render smooth, high-resolution graphs for CPU load, memory usage, and network traffic.
This "dashboard" approach is not merely for show; it is designed for immediate information density. On a single screen, a user can see the per-core utilization of their processor, the breakdown of used versus cached memory, disk read and write speeds, and even the temperature of various hardware components. For laptop users, a dedicated battery meter provides essential information about power status without requiring the user to glance at a desktop tray icon.
The network section is particularly noteworthy. Unlike many terminal tools that provide static numbers, btop features a dynamic network graph that scales automatically. Whether a connection is idling at a few kilobytes or saturating a gigabit line, the graph remains readable and informative. This level of visual polish makes btop feel less like a legacy command-line utility and more like a modern professional monitoring suite.
 Tech Tutorials & How-To Guides
A New Titan in Entertainment: Navigating the Skydance Merger and the Future of Streaming
The landscape of global media has undergone a seismic shift as the...
 Tech Tutorials & How-To Guides
Exploring the Frontiers of the Unknown: Three Essential Science Fiction Films to Stream on Netflix This Weekend
As the autumn of 2026 unfolds, the digital landscape of the American...
 Tech Tutorials & How-To Guides
The Case for the Cathode Ray Tube: Why Your Old Monitor is a Treasure, Not Trash
In an era defined by ultra-thin OLED panels, 4K resolutions, and refresh...