Granular Control and Interaction
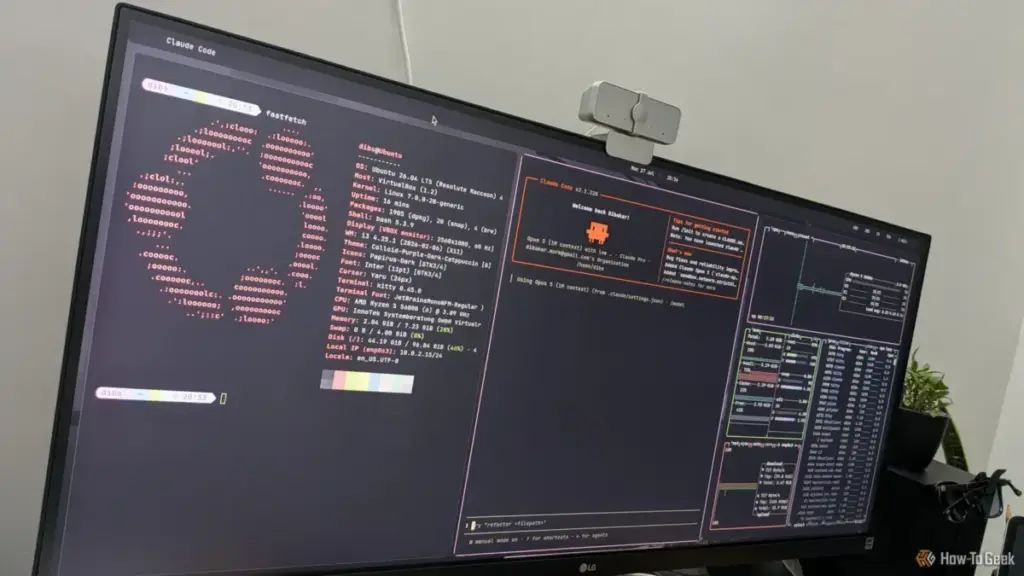
Beyond its visual appeal, btop differentiates itself through its deep interactivity. One of the most significant departures from traditional terminal monitors is its full support for mouse input. In an environment where the keyboard is usually king, btop allows users to click buttons, scroll through process lists, and navigate menus with a mouse or touchpad. This hybrid approach makes the tool accessible to those transitioning from graphical operating systems while remaining fully functional for keyboard purists.
The process management interface is where btop truly shines as a productivity tool. Users can navigate the process list using arrow keys or the mouse, but the functionality goes far beyond simple scrolling. The tool includes a robust filtering system, allowing users to find specific programs instantly. It also supports a "tree view," which visually maps the parent-child relationships between processes—an invaluable feature for identifying which specific tab or sub-process is causing a browser or development environment to hang.
When a process does misbehave, btop provides a streamlined workflow for intervention. Rather than requiring the user to memorize process IDs (PIDs) and manually type "kill" commands in a separate terminal window, btop allows users to select a process and send signals—such as SIGTERM, SIGINT, or SIGKILL—directly from the interface. This consolidation of monitoring and management into a single interactive pane significantly reduces the time required to troubleshoot system slowdowns.

A Performance-First Philosophy: The Shift to C++
The decision to build btop in C++ was driven by the need for systemic transparency with minimal impact. A resource monitor that consumes significant CPU cycles is, in many ways, a paradox. By utilizing C++, btop achieves a "near-metal" performance profile. The data collection is handled by a custom-built engine that interacts directly with the operating system’s kernels, whether it be the Linux procfs, the macOS IOKit, or the FreeBSD sysctl interface.
This efficiency is especially critical for users with older hardware or those managing high-density servers where every megabyte of RAM and every clock cycle counts. Despite its rich graphics and frequent refresh rates, btop maintains a remarkably small footprint. This makes it an ideal choice for "always-on" monitoring in a dedicated terminal multiplexer like tmux or screen, where it can run in the background for days or weeks without degrading system performance.
Cross-Platform Versatility and Modern Hardware Support
While btop began as a Linux-centric project, its popularity has led to a significant expansion in platform support. Official versions now exist for macOS and FreeBSD, and a community-led port known as "btop4win" brings the experience to Windows users via a separate repository. This cross-platform availability is a boon for system administrators who work in heterogeneous environments, allowing them to use a consistent set of tools regardless of the operating system they are currently managing.
Furthermore, btop has kept pace with modern hardware trends, most notably in the realm of GPU monitoring. As Linux gaming and AI development have surged, the need to monitor graphics hardware has become paramount. Recent builds of btop include support for NVIDIA, AMD, and Intel GPUs. Depending on the hardware and the specific binary used, users can track GPU utilization, VRAM consumption, power draw, and clock speeds right alongside their CPU metrics. While the depth of reporting varies—Intel hardware currently provides a more limited set of metrics compared to NVIDIA—the inclusion of GPU data completes the picture of total system health.
 Tech Tutorials & How-To Guides
The Seamless Transition: Why Linux Mint Remains the Premier Gateway for Windows Refugees
For many veteran technology enthusiasts, the journey through the landscape of Unix-like...
 Tech Tutorials & How-To Guides
Beyond the Brand: Why Even Premium Power Drills Fail Due to Common Operational Habits
In the modern landscape of home improvement and professional construction, the cordless...
 Tech Tutorials & How-To Guides
A New Titan in Entertainment: Navigating the Skydance Merger and the Future of Streaming
The landscape of global media has undergone a seismic shift as the...