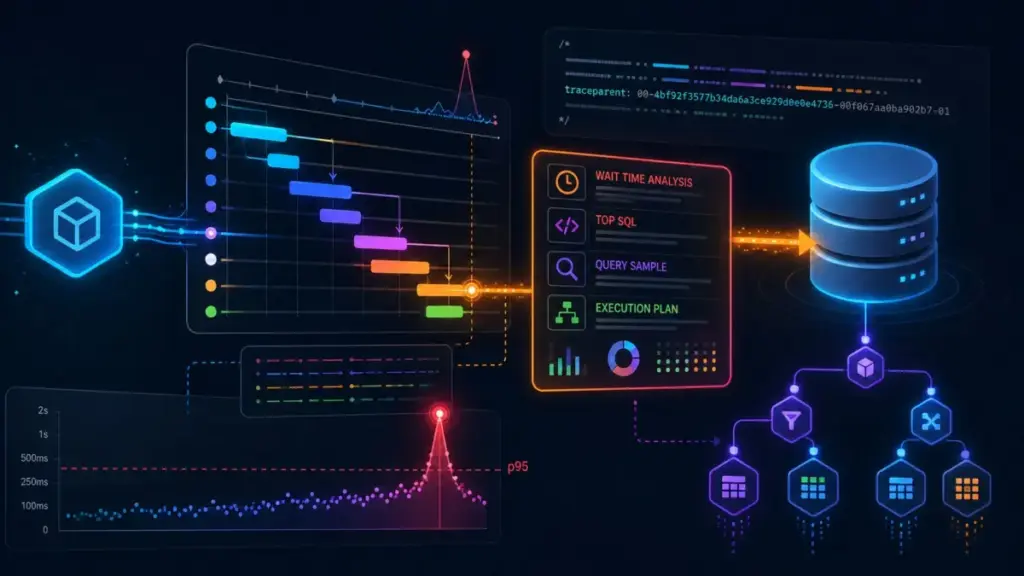
In the high-stakes environment of modern software reliability, not every performance crisis arrives with a siren. While a sudden spike in 500-level error codes or a total infrastructure collapse triggers immediate and obvious alarms, the "silent killers" of user experience are often more subtle. One of the most challenging scenarios for any DevOps or site reliability engineering (SRE) team is the unexplained drift in tail latency—specifically, a spike in the 95th percentile (p95) response times that occurs without a clear catalyst.
Consider a standard high-traffic API endpoint. Under normal operating conditions, its p95 latency remains a crisp 100ms, ensuring a responsive experience for the vast majority of users. Suddenly, that figure climbs to 380ms. The system isn’t "down," but for a significant portion of the user base, it is effectively broken. The initial triage reveals a frustrating lack of evidence: there are no reported errors in the logs, no recent code deployments have been pushed to production, and infrastructure alerts for CPU and memory utilization across the stack remain green.
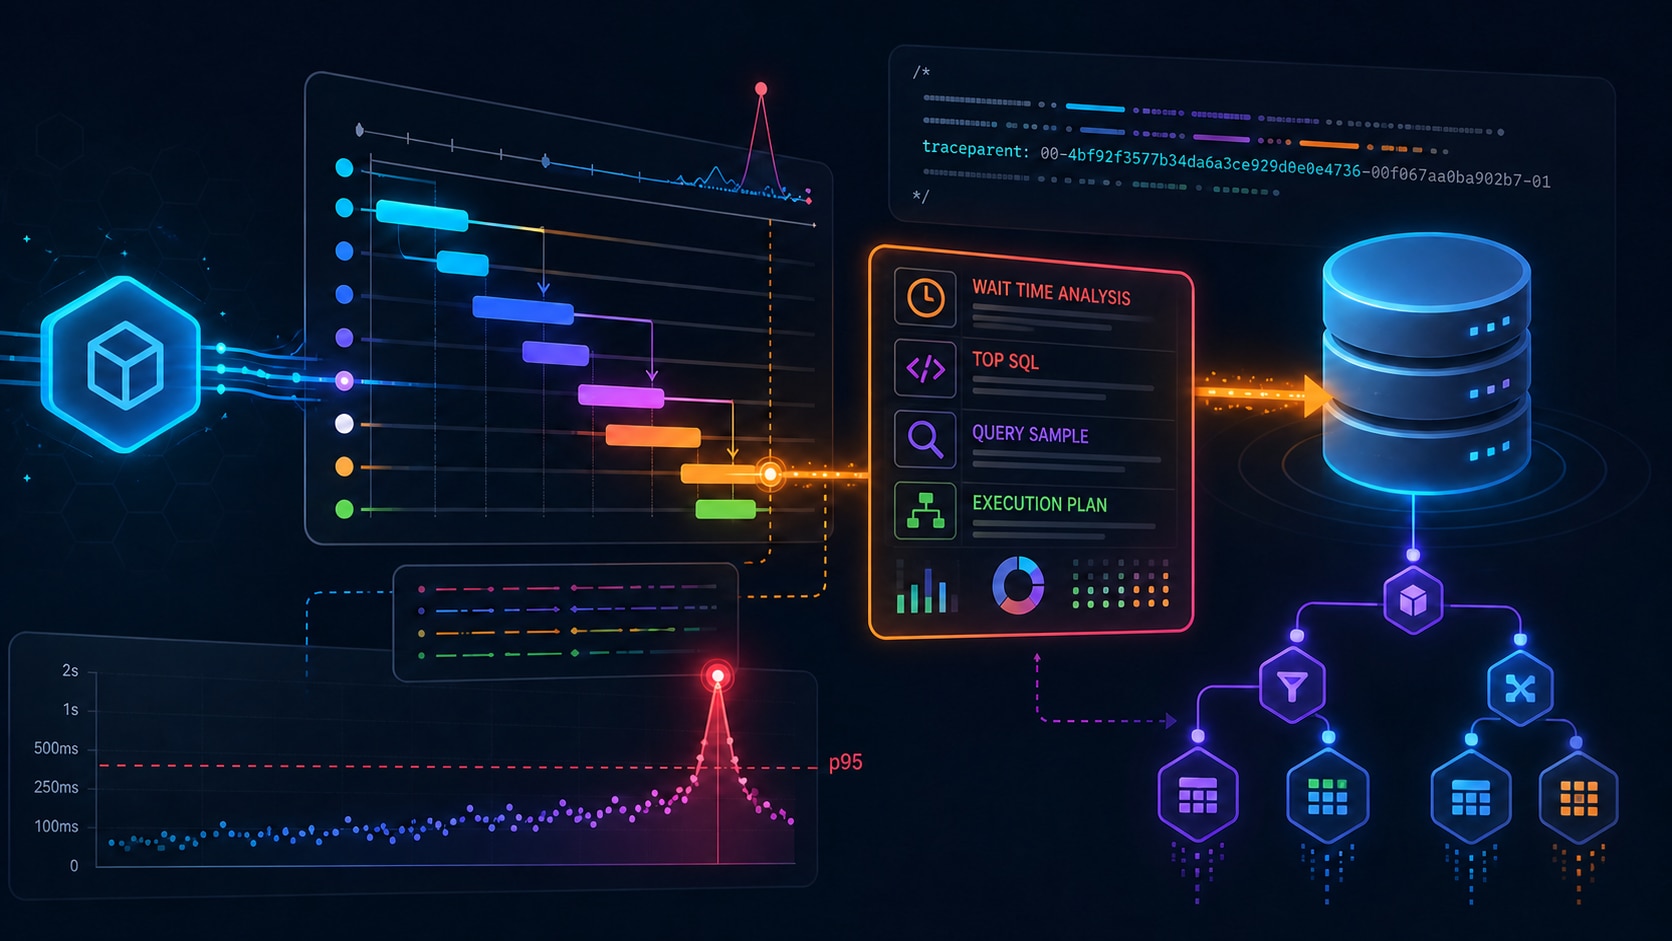
This represents the most difficult category of incident to resolve. Without a specific error message or a recent change event to serve as an anchor, the alert itself provides no clues as to which layer of the stack is responsible. To move beyond guesswork and avoid the common trap of inter-team finger-pointing, engineers must look deeper into the traces—specifically at the granular work occurring within the requests that have slowed down.
The Mechanics of Distributed Tracing and the Latency Budget
At the heart of modern performance diagnostics is distributed tracing, a technology that provides a topographical map of a request as it travels through various microservices and data stores. A distributed trace is essentially a tree structure composed of "spans." Each span represents a discrete unit of work, whether it is a service handling an incoming request, an outbound HTTP call to a third-party vendor, or a database query execution.
These spans are linked by a shared trace ID, and each carries precise timing data that records exactly when the work started and how long it lasted. In the context of the current latency crisis, these durations are viewed as a "latency budget." If a total request takes 380ms and a single database span accounts for 340ms of that time, the database has consumed approximately 89% of the total budget. This single metric transforms a vague suspicion into a concrete claim that warrants a deep-dive investigation into the data layer.
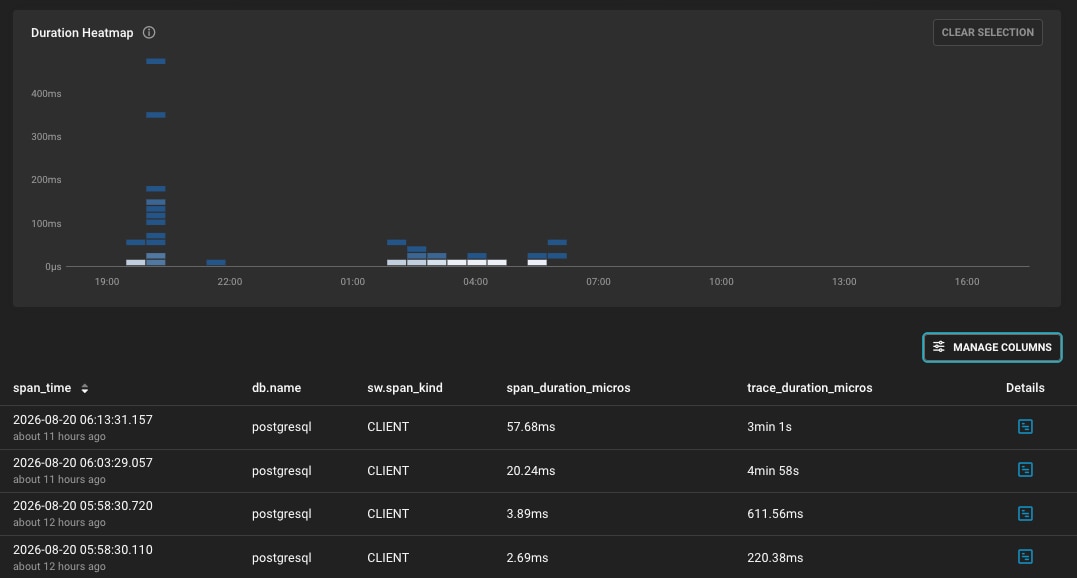
A critical component of this visibility is the adoption of OpenTelemetry semantic conventions. These industry-standard metadata attributes allow observability platforms to distinguish between different types of work. Database spans, for instance, are identified by specific attributes that detail the database system being used, the connection string, and the specific query being executed. This standardization ensures that regardless of the underlying technology, the observability layer can provide a consistent view of how the database is performing relative to the application code.
Establishing the Technical Bridge Between APM and Database Observability
While seeing a slow database span in an Application Performance Monitoring (APM) tool is a vital first step, it often stops short of explaining why the database is struggling. Traditionally, there has been a significant gap between the application’s view of a query and the database’s internal view of that same execution. SolarWinds Observability SaaS addresses this gap through a sophisticated integration between APM and Database Observability (DBO).
 Helpdesk & IT Service Management (ITSM)
Overe Appoints Former Sophos CSO Simon Reed as Strategic Advisor to Accelerate MSP Security Growth
In a significant move aimed at strengthening its leadership and deepening its...
 Helpdesk & IT Service Management (ITSM)
The Digital Athletes: SolarWinds Survey Reveals IT Professionals Navigate Modern Infrastructure with Championship-Level Precision
As the global business landscape becomes increasingly reliant on seamless digital operations,...
 Helpdesk & IT Service Management (ITSM)
OpenSSF and Tech Giants Call for Sustainable Funding to Secure Global Software Supply Chain
The OpenSSF (Open Source Security Foundation) Governing Board has issued an urgent...