
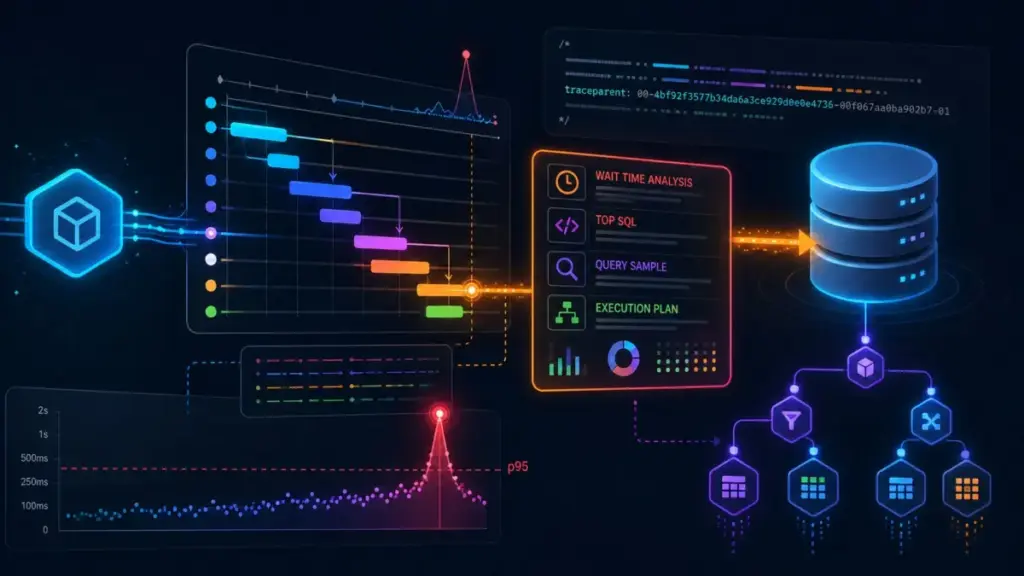
In the high-stakes environment of modern software reliability, not every performance crisis arrives with a siren. While a sudden spike in 500-level error codes or a total infrastructure collapse triggers immediate and obvious alarms, the "silent killers" of user experience are often more subtle. One of the most challenging scenarios for any DevOps or site reliability engineering (SRE) team is the unexplained drift in tail latency—specifically, a spike in the 95th percentile (p95) response times that occurs without a clear catalyst.
Consider a standard high-traffic API endpoint. Under normal operating conditions, its p95 latency remains a crisp 100ms, ensuring a responsive experience for the vast majority of users. Suddenly, that figure climbs to 380ms. The system isn’t "down," but for a significant portion of the user base, it is effectively broken. The initial triage reveals a frustrating lack of evidence: there are no reported errors in the logs, no recent code deployments have been pushed to production, and infrastructure alerts for CPU and memory utilization across the stack remain green.
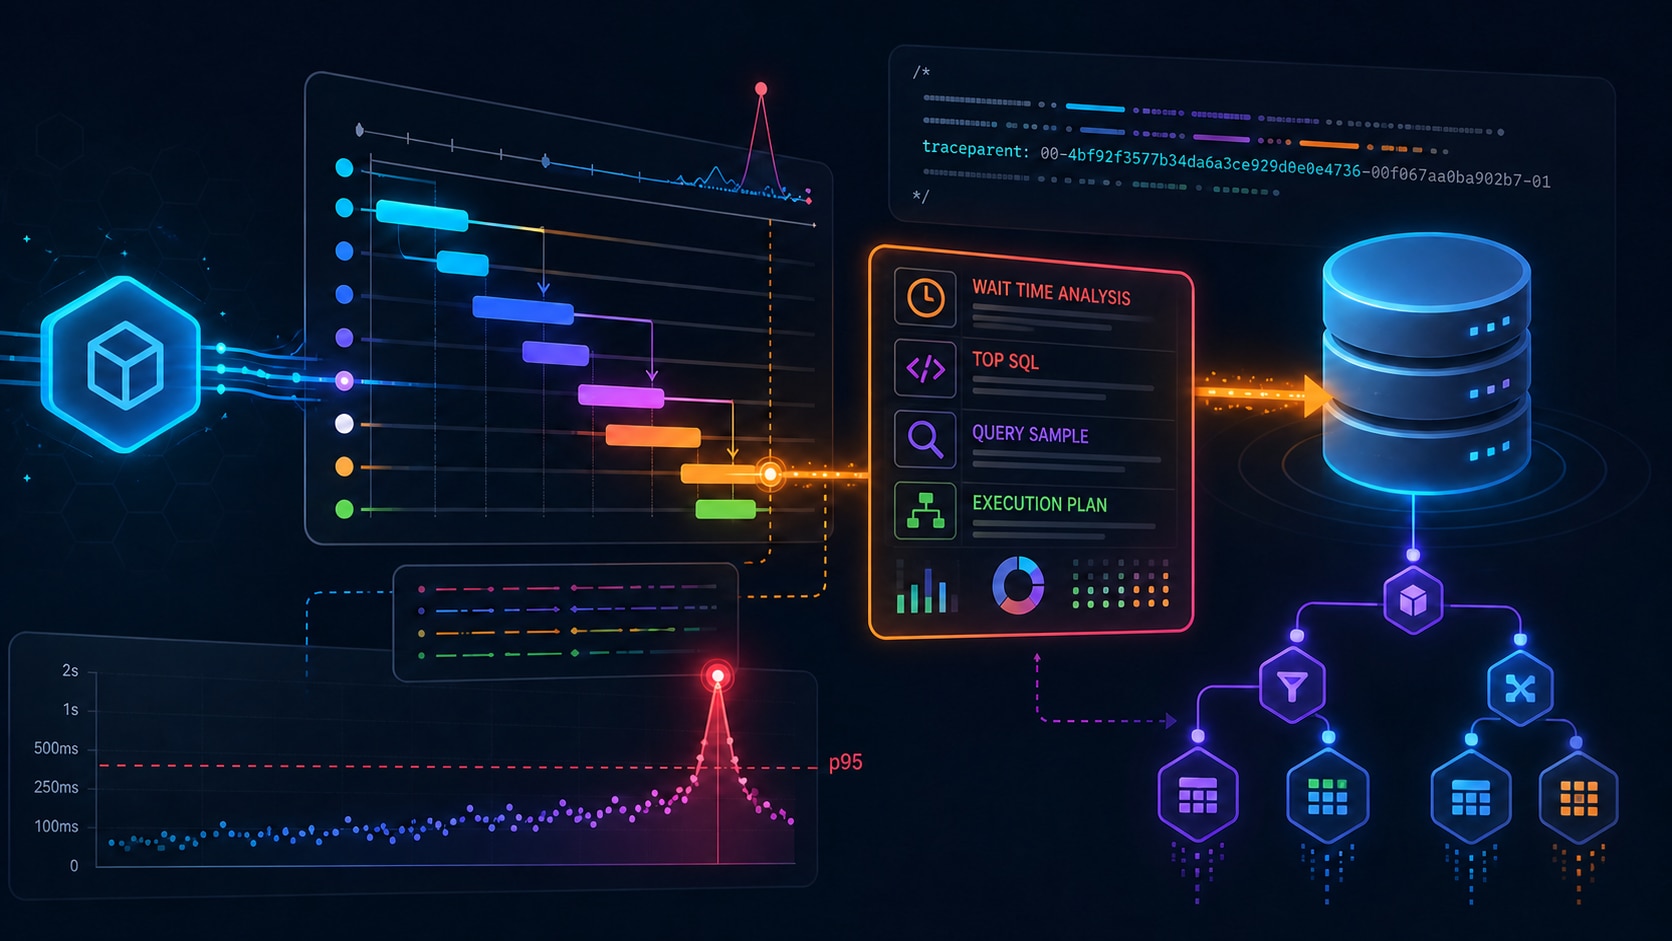
This represents the most difficult category of incident to resolve. Without a specific error message or a recent change event to serve as an anchor, the alert itself provides no clues as to which layer of the stack is responsible. To move beyond guesswork and avoid the common trap of inter-team finger-pointing, engineers must look deeper into the traces—specifically at the granular work occurring within the requests that have slowed down.
The Mechanics of Distributed Tracing and the Latency Budget
At the heart of modern performance diagnostics is distributed tracing, a technology that provides a topographical map of a request as it travels through various microservices and data stores. A distributed trace is essentially a tree structure composed of "spans." Each span represents a discrete unit of work, whether it is a service handling an incoming request, an outbound HTTP call to a third-party vendor, or a database query execution.
These spans are linked by a shared trace ID, and each carries precise timing data that records exactly when the work started and how long it lasted. In the context of the current latency crisis, these durations are viewed as a "latency budget." If a total request takes 380ms and a single database span accounts for 340ms of that time, the database has consumed approximately 89% of the total budget. This single metric transforms a vague suspicion into a concrete claim that warrants a deep-dive investigation into the data layer.
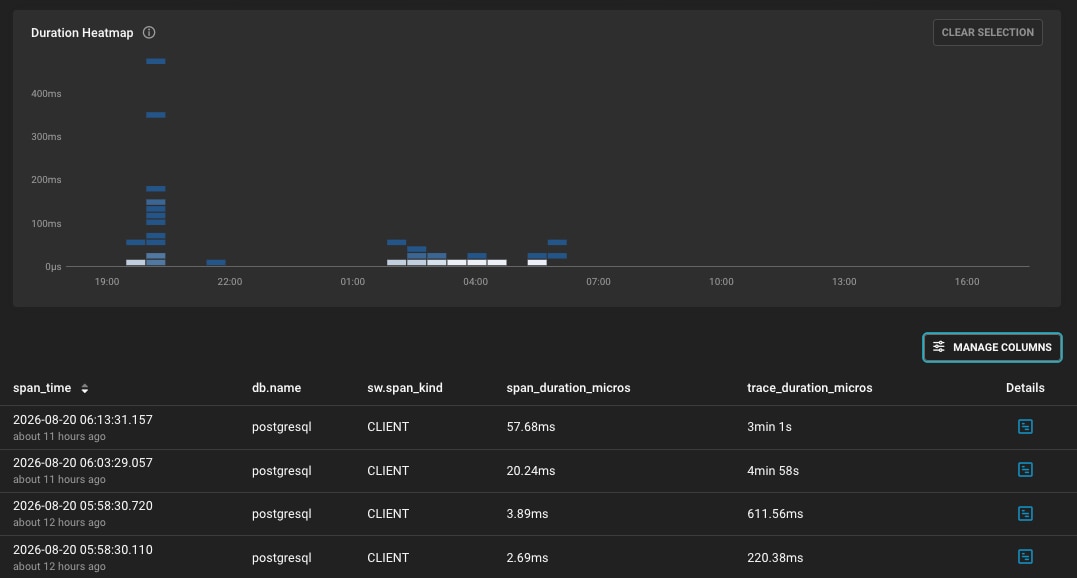
A critical component of this visibility is the adoption of OpenTelemetry semantic conventions. These industry-standard metadata attributes allow observability platforms to distinguish between different types of work. Database spans, for instance, are identified by specific attributes that detail the database system being used, the connection string, and the specific query being executed. This standardization ensures that regardless of the underlying technology, the observability layer can provide a consistent view of how the database is performing relative to the application code.
Establishing the Technical Bridge Between APM and Database Observability
While seeing a slow database span in an Application Performance Monitoring (APM) tool is a vital first step, it often stops short of explaining why the database is struggling. Traditionally, there has been a significant gap between the application’s view of a query and the database’s internal view of that same execution. SolarWinds Observability SaaS addresses this gap through a sophisticated integration between APM and Database Observability (DBO).
When the APM tool instruments an application, it can be configured to inject trace context directly into outgoing SQL queries. This is achieved by appending a comment to the SQL string, often formatted as a traceparent. This comment acts as a digital passport, traveling with the query from the application server to the database engine.
On the receiving end, the DBO Agent reads this comment during its sampling process. This mechanism creates a definitive link between the high-level application trace and the low-level database execution metrics. By correlating these two perspectives, engineers can move from a slow API call in the APM dashboard directly to the specific query execution evidence inside the database, bypassing the need to manually cross-reference timestamps or guess which query belonged to which request.
Investigating the Latency Spike in the APM Dashboard
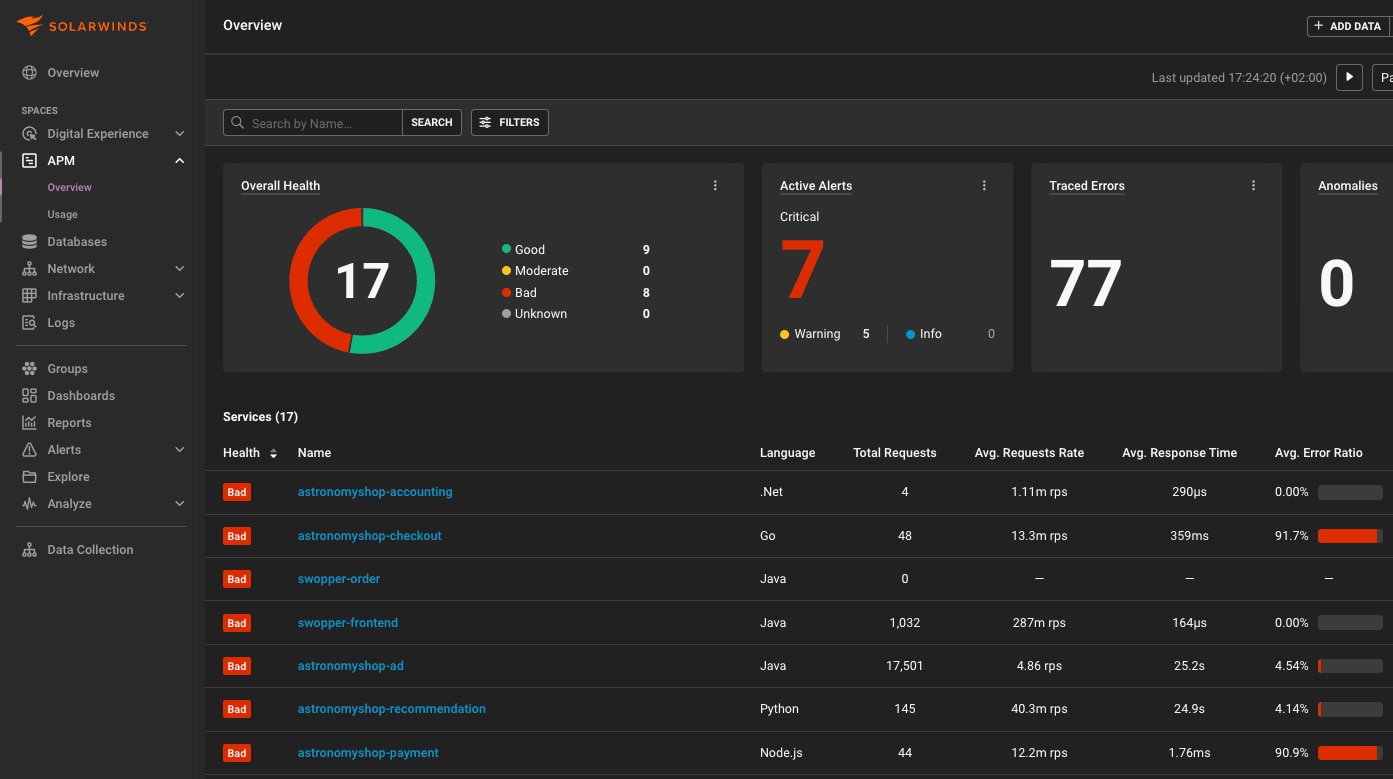
The journey to resolution begins in the APM service dashboard. In the current scenario, the response time trend confirms that the latency spike began several hours prior. A key observation during this phase is the throughput metric; if the request rate is flat, the slowdown cannot be attributed to a sudden surge in traffic pushing the service beyond its capacity. The service is failing to maintain its performance baselines even under typical load.
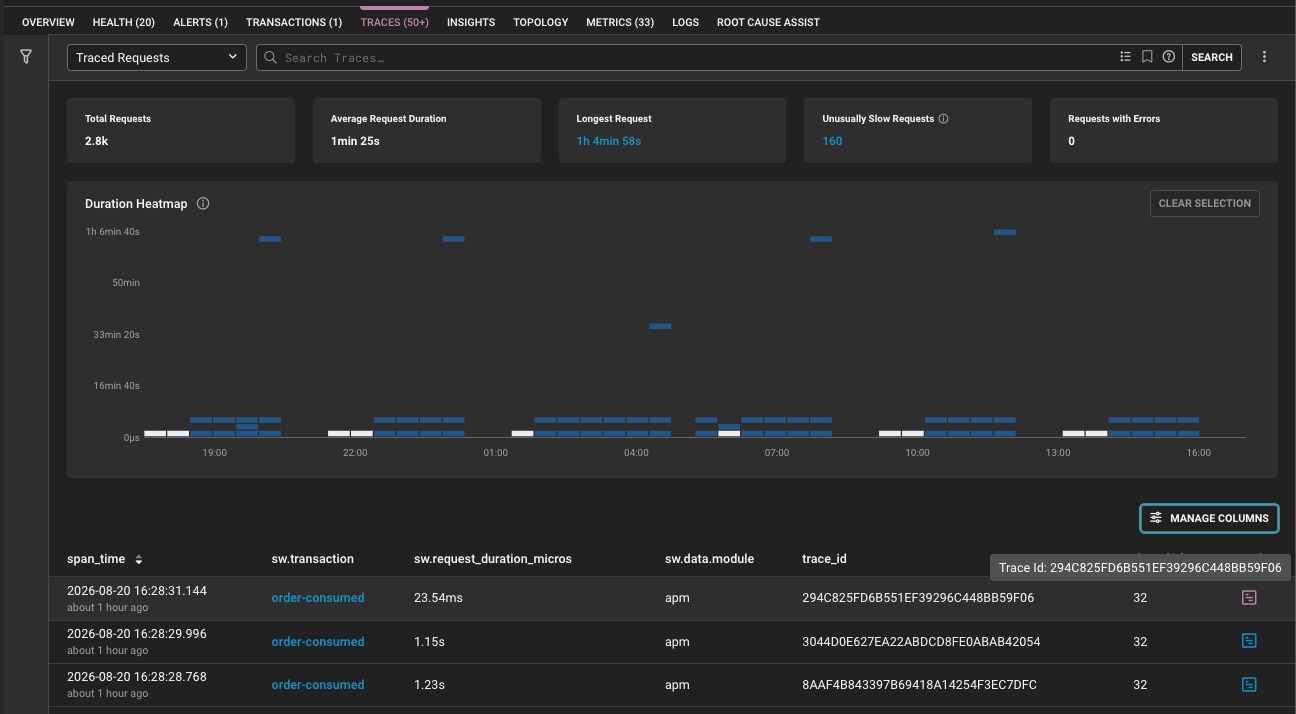
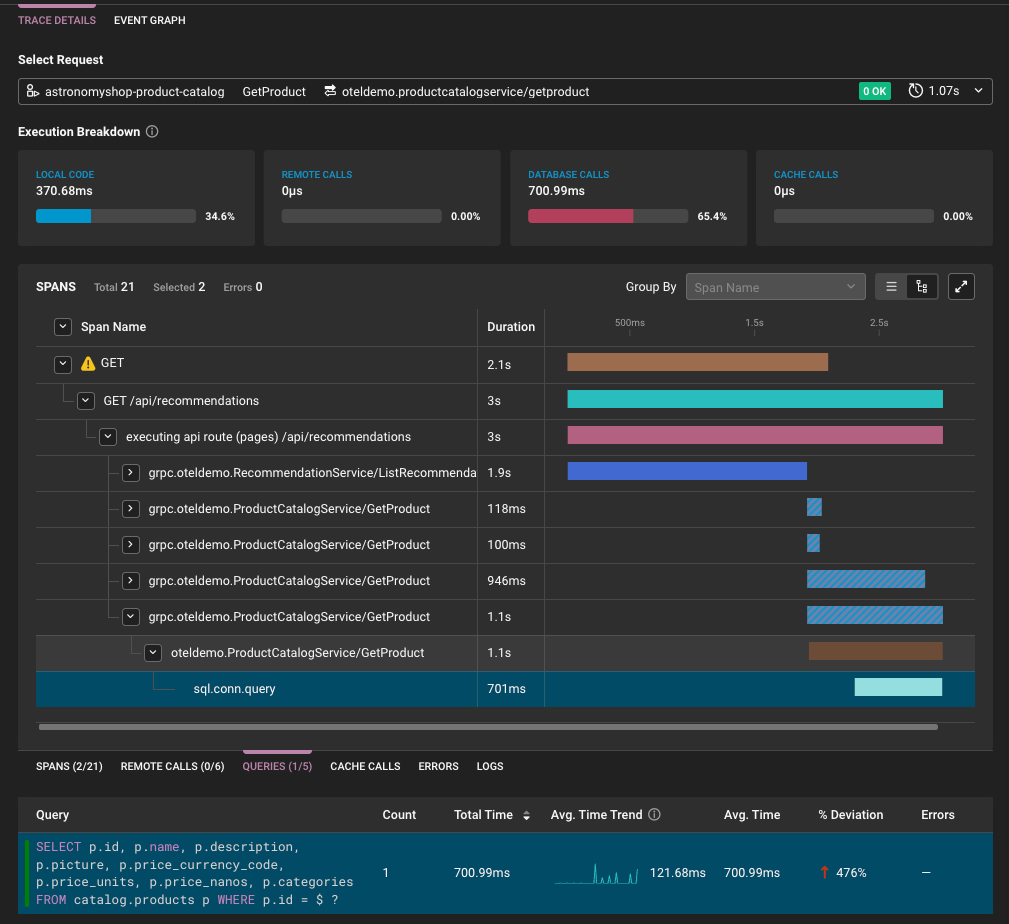
By navigating into the offending service and filtering the traces by duration, a pattern quickly emerges. The slow traces cluster at the top of the list, often sharing a nearly identical structure. Selecting one of these traces opens the Trace Details view, where the "Waterfall" visualization makes the bottleneck immediately apparent. In a healthy request, the work is distributed; in this incident, a single database span dominates the entire timeline.
The "Execution Breakdown" further quantifies the problem, showing that the application code accounts for only a tiny fraction of the total duration. The vast majority of the time is spent waiting for the database to return a result. Within the Span Details panel, a Query Response Time chart provides an additional layer of validation by comparing the span duration (measured from the application’s perspective) against the query execution time (measured by the database). When these two numbers track closely, it serves as a strong signal that the latency is rooted in the database engine itself, rather than network congestion or application-side overhead.
Pivoting to Database Observability for Root Cause Analysis
Once the database is identified as the primary source of latency, the investigation pivots to the DBO environment using the traceparent link. This shift in perspective is crucial because it moves the focus from the "client-side" experience to the "server-side" reality of the database engine.
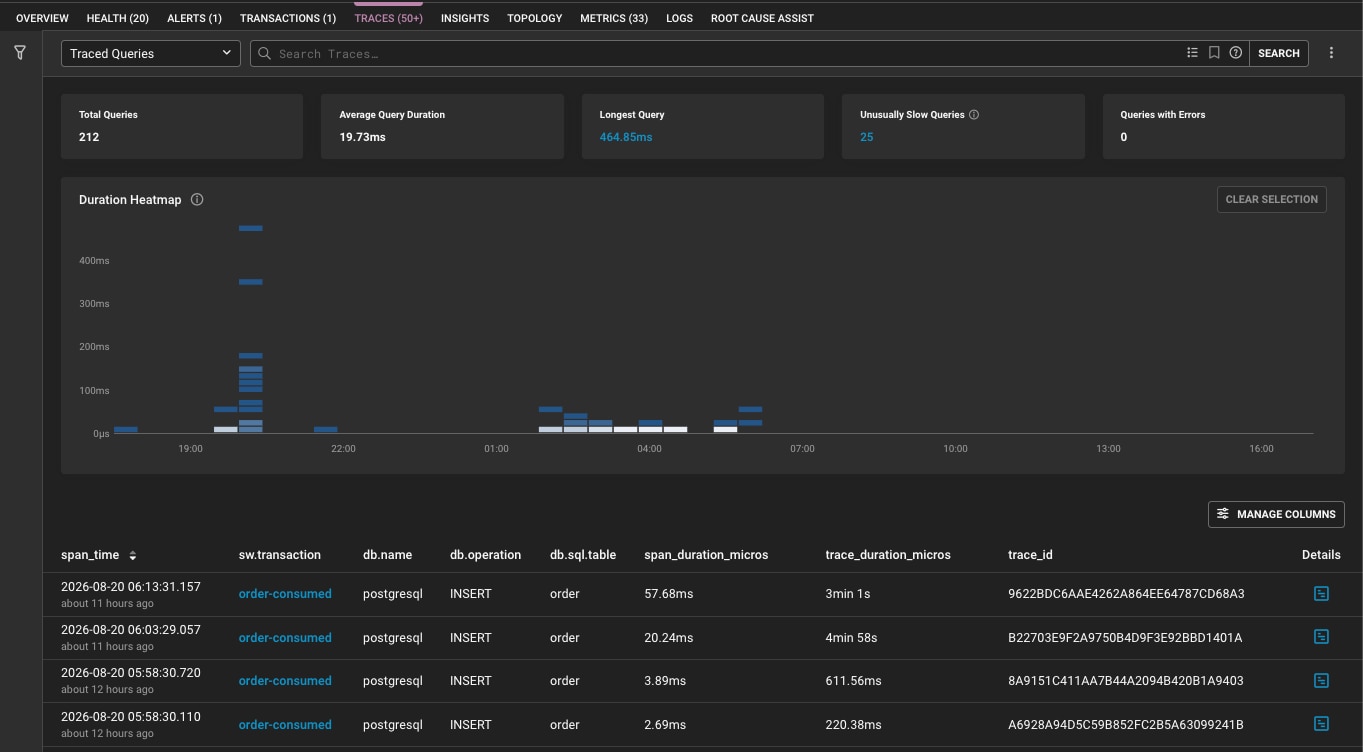
Inside the DBO Profiler, queries are ranked by resource consumption and frequency. The query family identified in the slow APM span typically appears at the top of the list. By examining the Samples tab for that specific query, engineers can see the raw query text and, more importantly, the server-side execution statistics, such as the number of rows examined. If slowness is consistent across all recent samples, it suggests a systemic issue with the query or its execution plan, rather than a transient problem like a "noisy neighbor" or temporary resource contention.
The most revealing evidence is often found in the Explain Plan tab. This feature allows engineers to see how the database planner decided to execute the query. If execution-plan history is available, a comparison between the current plan and an earlier, faster plan can reveal a "planner regression." Even without a code deployment, changes in table statistics or shifts in data distribution can lead the database planner to abandon a fast index in favor of a slow sequential scan.
Building the Evidence Package for Resolution
The final stage of the process is proving the case. An effective assessment requires gathering specific numbers that close the loop on the investigation. This involves confirming that the total request latency is dominated by the database call and verifying that the application’s internal processing time remains within its normal baseline.
In the case of a planner regression, the evidence is often stark. The database host may show elevated I/O, but the DBO metrics will clarify that this is a symptom of a sub-optimal sequential scan rather than the cause of the problem. By documenting the trace ID, the query digest, the discrepancy between client-side and server-side timings, and the evidence of the plan change, the SRE team can provide the database administrators (DBAs) with a complete "evidence package."
This integrated approach fundamentally changes the nature of the handoff between teams. Instead of a vague report that "the API is slow," the database team receives a targeted diagnostic report. They are told exactly which query is causing the delay, when the behavior changed, and which execution plan is at fault.
Understanding the Limitations and Requirements of Correlation
While the integration of APM and DBO is a powerful tool, it is not a universal solution. Successful correlation depends on several technical factors. For instance, a link between a trace and a DBO query might be missing if the trace wasn’t sampled, if the query hasn’t yet been processed by the DBO Agent, or if the trace-context injection was not configured correctly. In some environments, infrequently executed queries may take longer to appear in the linked views.
Furthermore, support for trace-context injection varies across different programming languages, database types, and drivers. Some implementations may struggle to insert comments into server-side prepared statements or complex stored procedures. Therefore, while close timings between APM and DBO are strong evidence of a database issue, they should always be validated against query samples and resource conditions.
Ultimately, the goal of integrating APM and DBO observability is to create a clearer chain of causality. By linking the high-level user experience to the low-level database behavior, organizations can reduce their Mean Time to Resolution (MTTR) and move from reactive firefighting to proactive performance management. When the database is the problem, knowing exactly why it is the problem is the only way to ensure it doesn’t happen again.
 Helpdesk & IT Service Management (ITSM)
Anthropic and Akamai Ink Landmark $11.6 Billion Compute Partnership to Fuel Long-Term AI Infrastructure Growth
In a move that underscores the staggering capital requirements of the generative...
 Helpdesk & IT Service Management (ITSM)
The Digital Athletes: SolarWinds Survey Reveals IT Professionals Navigate Modern Infrastructure with Championship-Level Precision
As the global business landscape becomes increasingly reliant on seamless digital operations,...
 Helpdesk & IT Service Management (ITSM)
SolarWinds Announces Comprehensive September Webinar Series to Address Evolving Database Challenges and AI Integration
The landscape of modern data management is undergoing a period of rapid...