
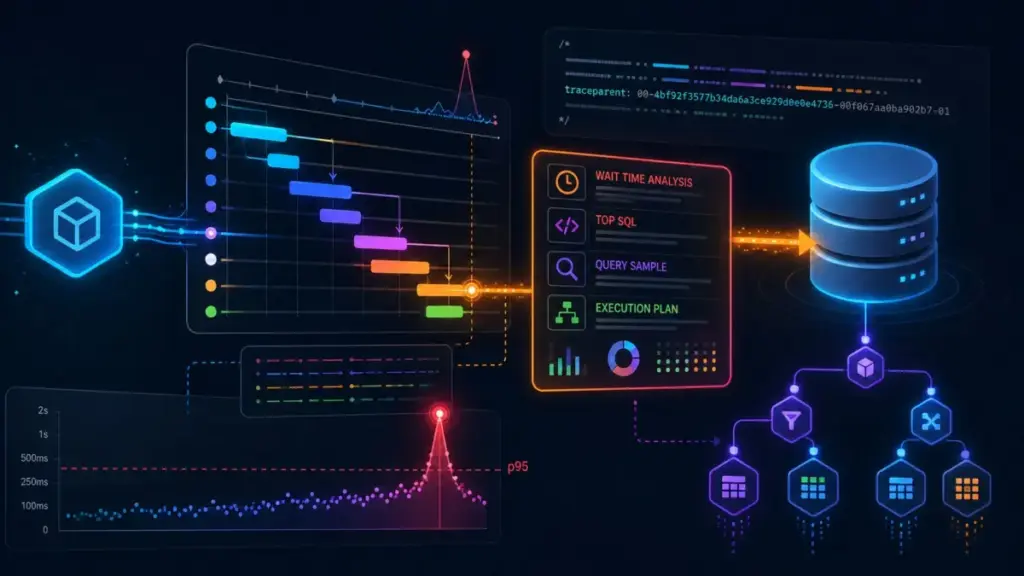
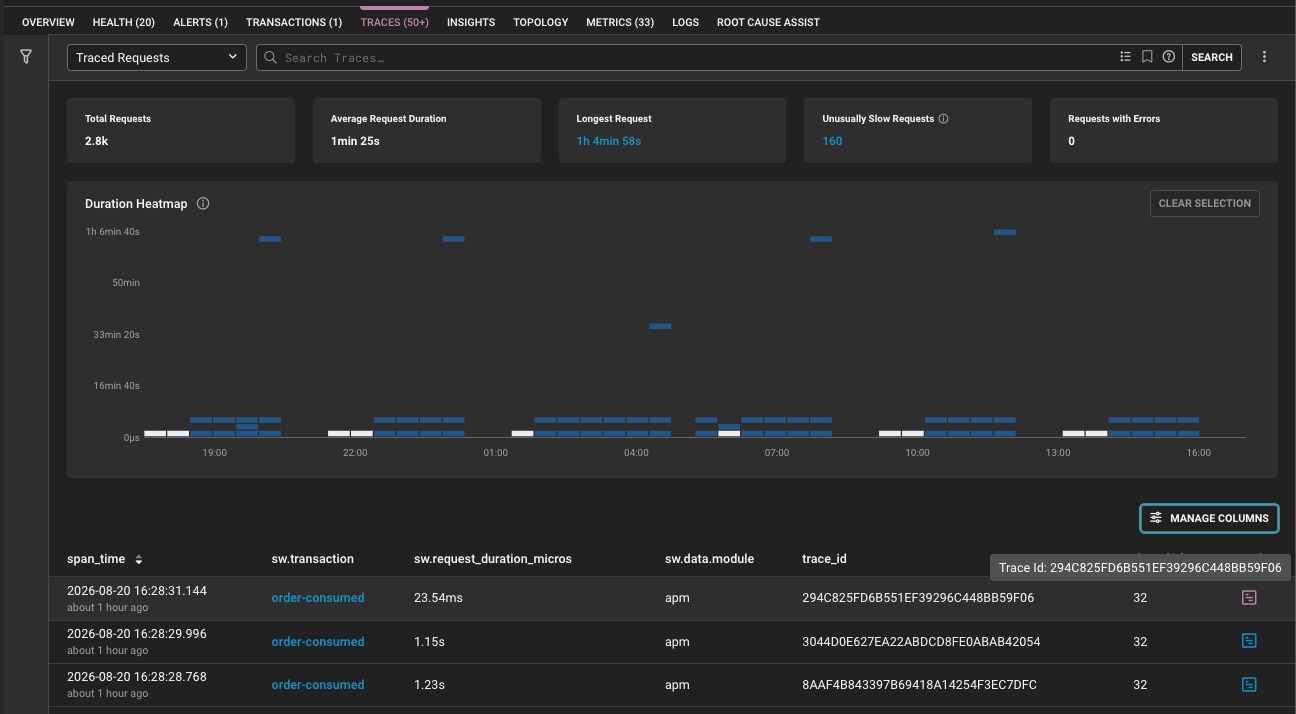
The most revealing evidence is often found in the Explain Plan tab. This feature allows engineers to see how the database planner decided to execute the query. If execution-plan history is available, a comparison between the current plan and an earlier, faster plan can reveal a "planner regression." Even without a code deployment, changes in table statistics or shifts in data distribution can lead the database planner to abandon a fast index in favor of a slow sequential scan.
Building the Evidence Package for Resolution
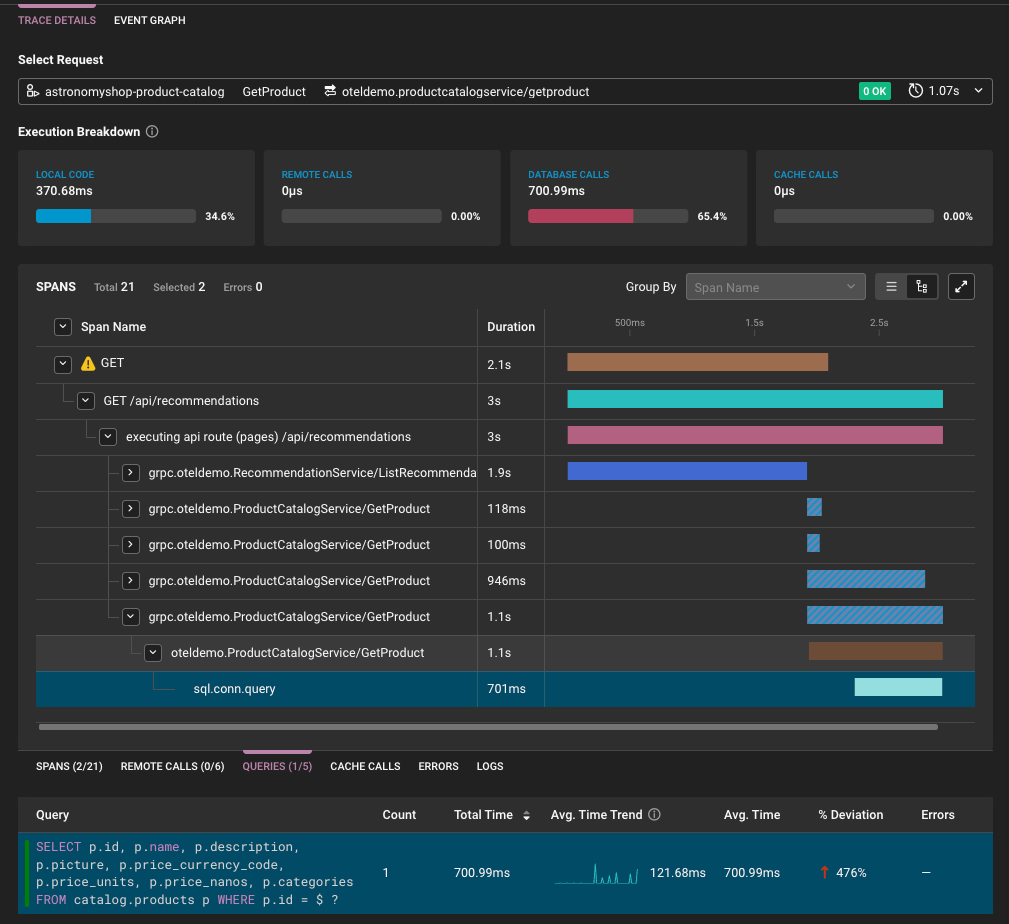
The final stage of the process is proving the case. An effective assessment requires gathering specific numbers that close the loop on the investigation. This involves confirming that the total request latency is dominated by the database call and verifying that the application’s internal processing time remains within its normal baseline.
In the case of a planner regression, the evidence is often stark. The database host may show elevated I/O, but the DBO metrics will clarify that this is a symptom of a sub-optimal sequential scan rather than the cause of the problem. By documenting the trace ID, the query digest, the discrepancy between client-side and server-side timings, and the evidence of the plan change, the SRE team can provide the database administrators (DBAs) with a complete "evidence package."
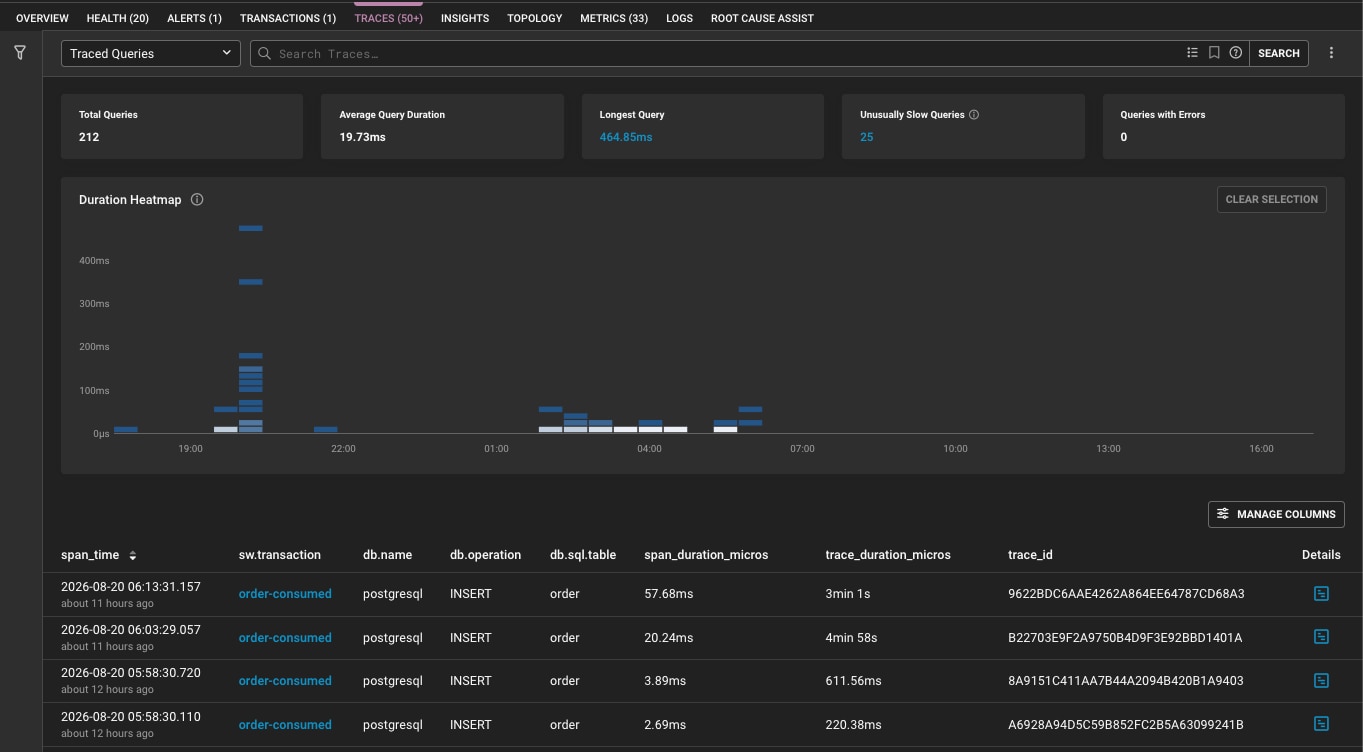
This integrated approach fundamentally changes the nature of the handoff between teams. Instead of a vague report that "the API is slow," the database team receives a targeted diagnostic report. They are told exactly which query is causing the delay, when the behavior changed, and which execution plan is at fault.
Understanding the Limitations and Requirements of Correlation
While the integration of APM and DBO is a powerful tool, it is not a universal solution. Successful correlation depends on several technical factors. For instance, a link between a trace and a DBO query might be missing if the trace wasn’t sampled, if the query hasn’t yet been processed by the DBO Agent, or if the trace-context injection was not configured correctly. In some environments, infrequently executed queries may take longer to appear in the linked views.
Furthermore, support for trace-context injection varies across different programming languages, database types, and drivers. Some implementations may struggle to insert comments into server-side prepared statements or complex stored procedures. Therefore, while close timings between APM and DBO are strong evidence of a database issue, they should always be validated against query samples and resource conditions.
Ultimately, the goal of integrating APM and DBO observability is to create a clearer chain of causality. By linking the high-level user experience to the low-level database behavior, organizations can reduce their Mean Time to Resolution (MTTR) and move from reactive firefighting to proactive performance management. When the database is the problem, knowing exactly why it is the problem is the only way to ensure it doesn’t happen again.
 Helpdesk & IT Service Management (ITSM)
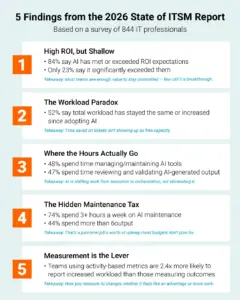
The Hidden Complexity of Efficiency: SolarWinds Report Reveals the Dual Nature of AI in the Modern Service Desk
The promise of artificial intelligence within Information Technology Service Management (ITSM) has...
 Helpdesk & IT Service Management (ITSM)
SolarWinds Announces Comprehensive September Webinar Series to Address Evolving Database Challenges and AI Integration
The landscape of modern data management is undergoing a period of rapid...
 Helpdesk & IT Service Management (ITSM)
Strategic Espionage Campaign Linked to Chinese Threat Actor Targets Global AI Policy Experts
In a sophisticated display of targeted cyber espionage, a threat actor aligned...