
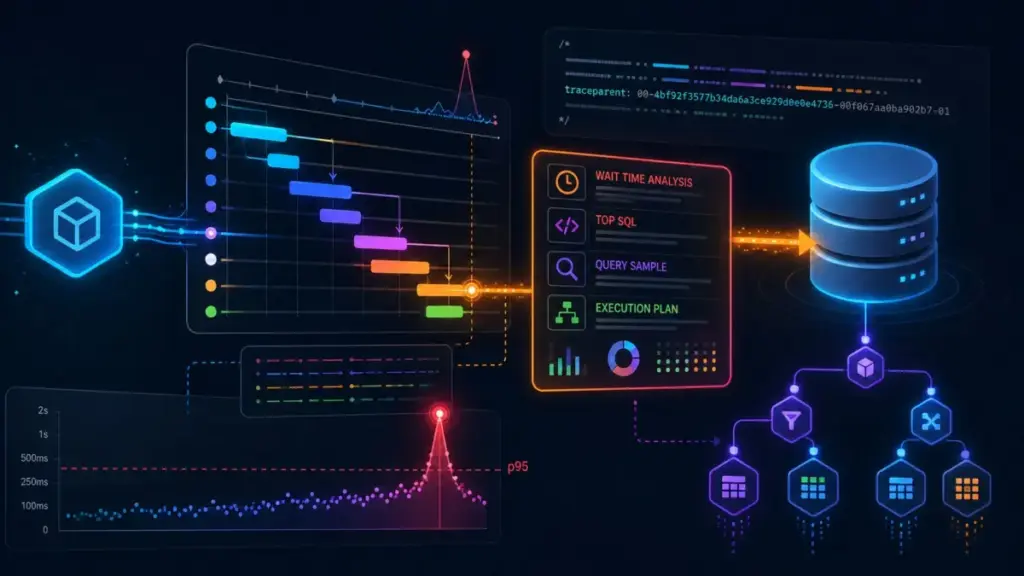
When the APM tool instruments an application, it can be configured to inject trace context directly into outgoing SQL queries. This is achieved by appending a comment to the SQL string, often formatted as a traceparent. This comment acts as a digital passport, traveling with the query from the application server to the database engine.
On the receiving end, the DBO Agent reads this comment during its sampling process. This mechanism creates a definitive link between the high-level application trace and the low-level database execution metrics. By correlating these two perspectives, engineers can move from a slow API call in the APM dashboard directly to the specific query execution evidence inside the database, bypassing the need to manually cross-reference timestamps or guess which query belonged to which request.
Investigating the Latency Spike in the APM Dashboard
The journey to resolution begins in the APM service dashboard. In the current scenario, the response time trend confirms that the latency spike began several hours prior. A key observation during this phase is the throughput metric; if the request rate is flat, the slowdown cannot be attributed to a sudden surge in traffic pushing the service beyond its capacity. The service is failing to maintain its performance baselines even under typical load.
By navigating into the offending service and filtering the traces by duration, a pattern quickly emerges. The slow traces cluster at the top of the list, often sharing a nearly identical structure. Selecting one of these traces opens the Trace Details view, where the "Waterfall" visualization makes the bottleneck immediately apparent. In a healthy request, the work is distributed; in this incident, a single database span dominates the entire timeline.
The "Execution Breakdown" further quantifies the problem, showing that the application code accounts for only a tiny fraction of the total duration. The vast majority of the time is spent waiting for the database to return a result. Within the Span Details panel, a Query Response Time chart provides an additional layer of validation by comparing the span duration (measured from the application’s perspective) against the query execution time (measured by the database). When these two numbers track closely, it serves as a strong signal that the latency is rooted in the database engine itself, rather than network congestion or application-side overhead.
Pivoting to Database Observability for Root Cause Analysis
Once the database is identified as the primary source of latency, the investigation pivots to the DBO environment using the traceparent link. This shift in perspective is crucial because it moves the focus from the "client-side" experience to the "server-side" reality of the database engine.
Inside the DBO Profiler, queries are ranked by resource consumption and frequency. The query family identified in the slow APM span typically appears at the top of the list. By examining the Samples tab for that specific query, engineers can see the raw query text and, more importantly, the server-side execution statistics, such as the number of rows examined. If slowness is consistent across all recent samples, it suggests a systemic issue with the query or its execution plan, rather than a transient problem like a "noisy neighbor" or temporary resource contention.
 Helpdesk & IT Service Management (ITSM)
SolarWinds Announces Comprehensive September Webinar Series to Address Evolving Database Challenges and AI Integration
The landscape of modern data management is undergoing a period of rapid...
 Helpdesk & IT Service Management (ITSM)
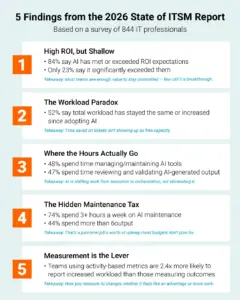
The Hidden Complexity of Efficiency: SolarWinds Report Reveals the Dual Nature of AI in the Modern Service Desk
The promise of artificial intelligence within Information Technology Service Management (ITSM) has...
 Helpdesk & IT Service Management (ITSM)
SolarWinds Service Desk September Update Introduces Advanced Process Integrations and Microsoft Teams Automation
As IT environments become increasingly complex and distributed, the demand for more...