
In a comprehensive release that provides a rare glimpse into the high-volume mechanics of the domain name secondary market, registrar Dynadot has published its Quarterly Intelligence Report for the second quarter. The data, which tracks more than 54,000 individual aftermarket transactions, highlights a market characterized by massive liquidity at the lower end of the price spectrum and a significant concentration of wealth at the very top. While the sheer number of sales suggests a bustling ecosystem, the underlying figures reveal that the vast majority of the activity involves low-cost acquisitions, largely driven by the expired domain auction process.
The sheer scale of the 54,000 sales reported by Dynadot is a testament to the registrar’s significant footprint in the industry. However, industry analysts and investors must look past the headline figure to understand the composition of these sales. A critical takeaway from the report is that these figures include the company’s expired domain sales. When a registrant fails to renew a domain name, it typically enters an auction phase where speculators and end-users can bid on the rights to the name before it is released back to the general pool for fresh registration. This process accounts for the lion’s share of the volume seen in the Q2 data.
The dominance of the expiry market is most clearly reflected in the median sale price for the quarter, which stood at a modest $18.87. This figure indicates that half of all sales occurred at or below this price point, which is only slightly higher than the standard annual registration and renewal fees for many popular top-level domains (TLDs). This low median price underscores the fact that the bulk of the market is not comprised of high-stakes negotiations for premium digital real estate, but rather the steady, automated, and high-volume churn of expired assets being reclaimed by the market.
Further breaking down the pricing tiers, the report reveals a stark disparity between volume and revenue. Nearly 89% of all sales during the second quarter were closed for less than $50. While these thousands of small-scale transactions represent the vast majority of the work being done on the platform, they accounted for only a third of the total aftermarket sales revenue. This segment of the market is often populated by domain "flippers" looking for quick, low-margin turnovers, or individuals seeking affordable names for small projects and personal use.
In contrast, the top tier of the market—those sales exceeding $1,000—represented less than 1% of the total number of orders. Despite their rarity, these premium transactions contributed a full third of the overall aftermarket revenue for the quarter. This "power law" distribution is a common feature of the domain industry, where a handful of high-value assets, often short, memorable, or keyword-rich .com domains, provide the financial backbone for the entire aftermarket. It highlights the dual nature of domaining: a high-volume, low-margin "grind" at the bottom, and a low-volume, high-stakes "luxury" market at the top.
The dominance of the .com TLD remains unchallenged, according to the Dynadot data. During the second quarter, .com domains made up a commanding 70.6% of all orders. This consistent performance reinforces the .com extension’s status as the "gold standard" of the internet, favored by businesses, investors, and consumers alike for its perceived authority and global recognition. Even as hundreds of new TLDs have entered the market over the last decade, the secondary market continues to revolve almost entirely around the original commercial extension.
Following .com, the .org extension held the second-place spot, accounting for 6.4% of sales. As the preferred extension for non-profits, foundations, and community organizations, .org maintains a steady and reliable presence in the aftermarket. Its performance suggests a healthy, if specialized, demand for established organizational identifiers.
The most surprising revelation in the TLD rankings was the performance of the .cc extension. Taking the third-place spot with 4.1% of all sales, .cc outperformed many more common extensions. Originally the country code top-level domain (ccTLD) for the Cocos (Keeling) Islands, .cc has long been marketed as a "creative" or "commercial" alternative to .com. Its high ranking in the Dynadot report is unexpected and suggests a localized surge in interest or a specific segment of the speculative market focusing on short, two-letter extensions, which are often available under the .cc banner.
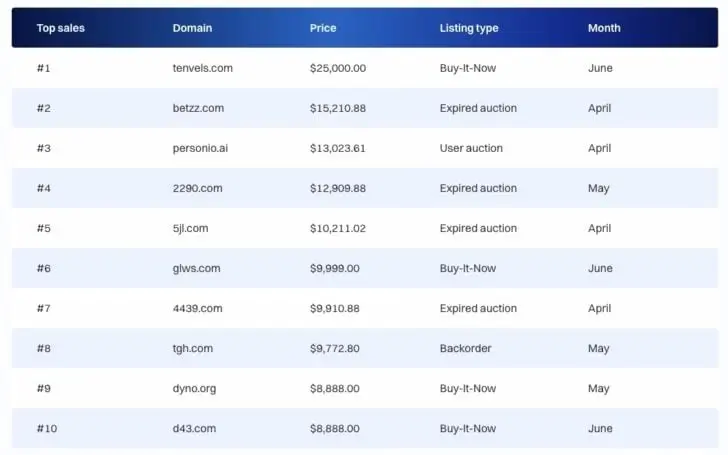
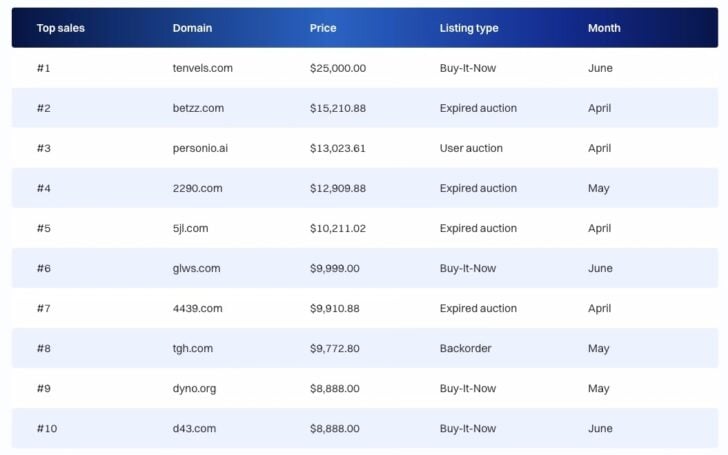
While the report focuses heavily on volume and trends, the individual high-value sales provide the most intrigue for industry observers. Dynadot’s top ten sales for the quarter were led by a variety of short and brandable assets. However, one specific sale raised eyebrows among veteran domain investors: the sale of tgh.com.
The domain tgh.com, a rare and highly liquid three-letter .com, sold for less than $10,000 during the quarter. In the world of domain investing, three-letter .com names are considered "blue-chip" assets. There are only 17,576 possible combinations of three-letter .com domains, and they are almost universally owned. Typically, these domains command five-figure or even six-figure prices depending on the specific letter combination and the presence of an "end-user" buyer with a matching corporate acronym. The fact that tgh.com changed hands for a four-figure sum suggests that the sale may have occurred in a highly competitive auction environment or that the market for certain three-letter combinations is seeing a moment of pricing volatility.
The full top ten list for the quarter includes:
- tgh.com
- 364.com
- any.ai
- 7707.com
- ite.com
- uqi.com
- 1928.com
- rtp.org
- ttt.cc
- btc.cc
The presence of numeric domains like 364.com, 7707.com, and 1928.com in the top ten highlights the continued strength of the Chinese and global numeric domain market, where numbers are often traded based on their length, patterns, and cultural significance. Additionally, the inclusion of any.ai reflects the ongoing boom in artificial intelligence, which has driven the .ai extension (the ccTLD for Anguilla) to record-breaking heights over the past two years as tech startups scramble for relevant branding. The appearance of btc.cc also points toward the intersection of the domain market and the cryptocurrency sector, where "BTC" remains the most sought-after acronym.
The Dynadot report serves as a reminder of the complexity of the domain name aftermarket. While the high-profile, million-dollar sales often capture the headlines, the reality of the market is found in the 54,000 transactions that occur in the trenches. The data shows a market that is deeply bifurcated: a massive, low-cost engine driven by the automated recycling of expired domains, and a thin, elite layer of premium assets that generate the majority of the value.
For investors, the takeaway is clear: liquidity is highest at the bottom, but wealth is concentrated at the top. The continued dominance of .com ensures that it remains the safest bet for most, while the surprising rise of .cc and the sustained interest in .ai and numeric domains show that there are still opportunities for those willing to look beyond the traditional "dot-com" horizon.
As the industry moves into the second half of the year, the trends established in Q2—high volume, low median prices, and the enduring reign of the .com extension—are expected to persist. However, the unexpected pricing of assets like tgh.com will likely lead to increased scrutiny of auction dynamics and a renewed focus on finding value in a market that remains as unpredictable as it is vast.
 Web Hosting & Domain Management
The AI-Driven Acceleration of the Domain Aftermarket: Why 2026 is Seeing Record-Breaking Development Speeds
The secondary market for domain names has long been characterized by a...
 Web Hosting & Domain Management
Major Domain Registrars Challenge auDA Over Policy Shifts Threatening Millions of .au Registrations
A coalition of ten prominent domain name registrars has formally petitioned the...
 Web Hosting & Domain Management
WIPO Panel Rebukes Temperley Holdings in Attempted Takeover of Founder’s Personal Domain Name
In a significant ruling that underscores the complexities of personal branding and...